|
0 Comments
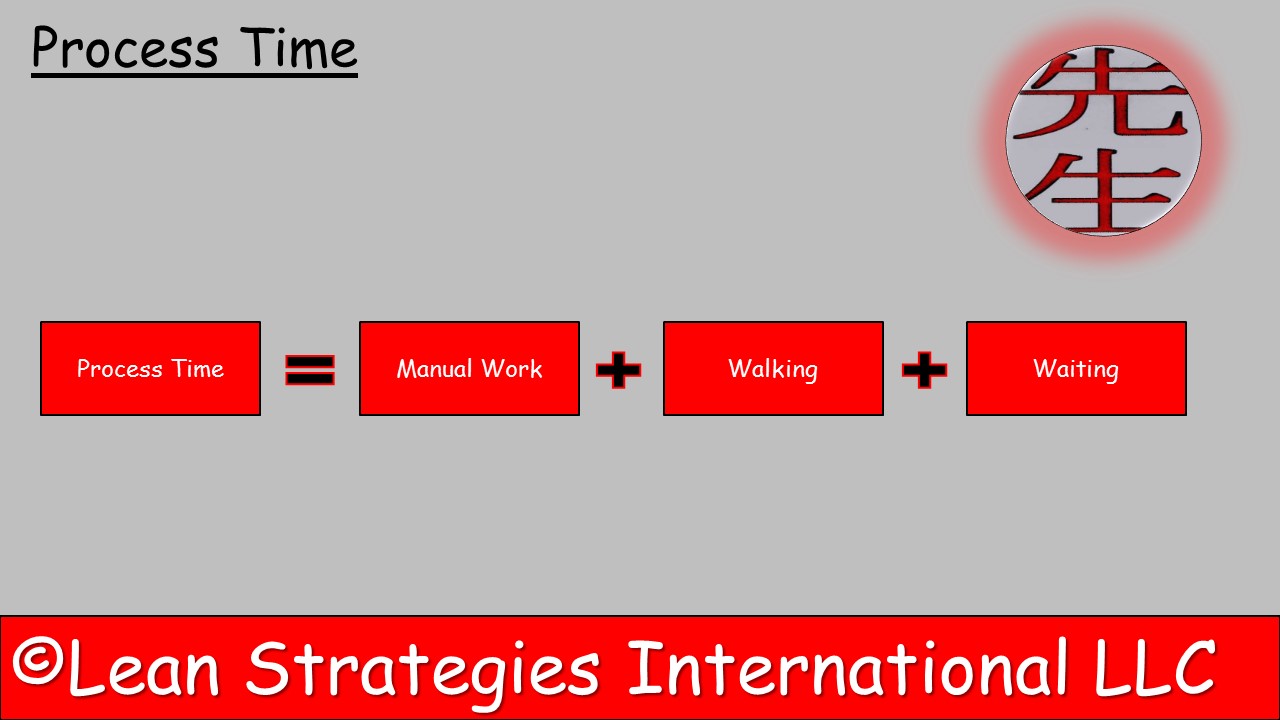 Click on the photo above to see Lean Strategies International LLC's Services. Process time is the time that the product or service is actually being worked on by an operator or employee. Process times can be observed and gathered using a stopwatch.
This glossary definition contains Amazon Affiliate links. As an Associate We earn from Purchases. In the most basic form 3D printing is a process by which layers of material are added to create various products and components. This process, known as additive manufacturing allows people to create complex products like: Aerospace products, cases and many supplies for various divisions of the military at a fraction of the price it would take to mold or sculpt different items. Products and components are most often created using CAD drawings or 3D models. Once the design is complete it is then sent over to a 3D printer so the additive manufacturing process can begin. One exciting note about the 3D printing process is that in today's day and age many of the machines are available for use inside your home. We will list our top 5 options in the description below.
 Click on the photo above to see Lean Strategies International LLC's Services. Six sigma and many other forms of project management use "tollgates" to check the progress of projects in relation to their objectives. When an assigned individual approves that the team has successfully completed one stage of the project, the team then can "pass" on to the next stage of the project or initiative. If the team does not successfully complete a stage they can not "pass" on to the next phase.
 Click on the photo above to see Lean Strategies International LLC's Services. The histogram is a type of bar graph which is used to visually display the frequency or spread of data in a data set.
 The check sheet is a structured data-recording tool. This generic tool is designed by users to facilitate, organize and track their interpretation of results. The check sheet is one of the seven basic quality tools.
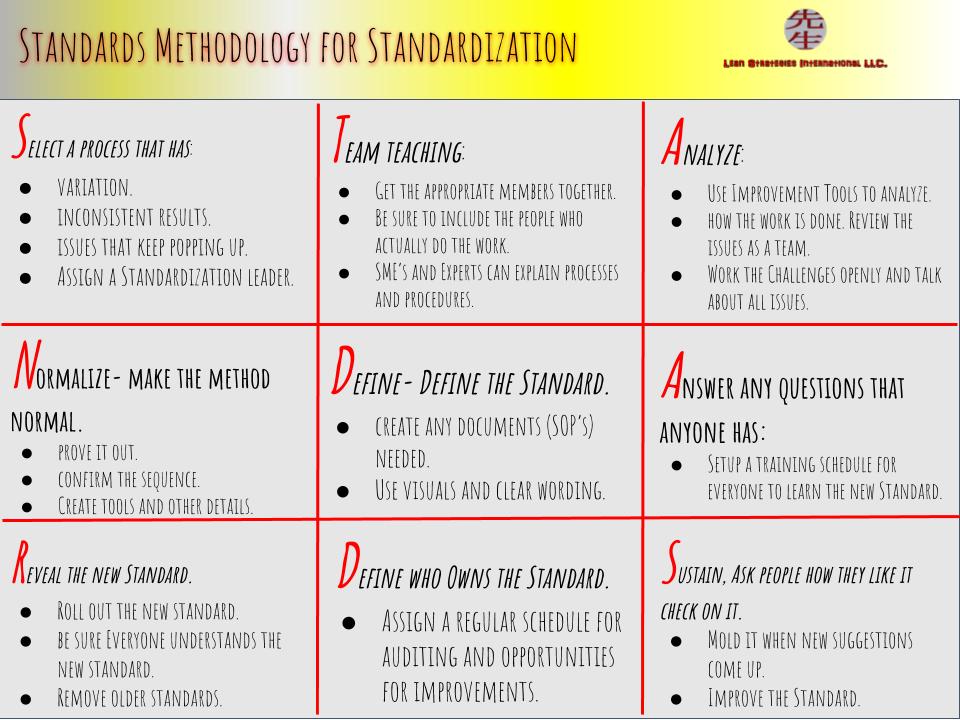 Click on the photo above to see Lean Strategies International LLC's Services. The STANDARDS Methodology is a simple 9 step process that can be used as a method for standardizing.
 Click on the photo above to see Lean Strategies International LLC's Services. Outsourcing is the process of obtaining a good, service or information from an "outside" or foreign supplier. Outsourcing is used in place of "internal sourcing" and is not the same as "insourcing".
 Click on the photo above to see Lean Strategies International LLC's Services. The nomogram is a computational aid which consists of two or more scales which are drawn and arranged so that results of calculations may be found by the linear connection points. The graph usually contains three parallel scales graduated for different variables so that when a straight line connects each value of any two, that value can be read directly from the third at the point of intersection. Also Called: Alignment Chart  Click on the photo above to see Lean Strategies International LLC's Services. Bias is a term frequently used in forecasting and six sigma. Bias is the term used when a consistent deviation occurs from the mean/average.
 Click on the photo above to see Lean Strategies International LLC's Services. A standard is a rule, example or guideline of how to perform an activity correctly. Standards should be the best known way of performing, building or producing a product, task, process or service. All standards should set clear expectations.
 Click on the photo above to see Lean Strategies International LLC's Services. The core values of an organization are the principles, fundamental beliefs and ethical guideposts that serve as guidelines for the organizations behaviors.
 Click on the photo to visit Lean Strategies International LLC's Service Page. Pareto’s concept suggests that most effects come from relatively few causes. To be even more specific Pareto’s concept suggests that 80% of effects are directly related to 20% of causes. The principle is often used in the narrowing down of choices and focusing in on priorities. To Learn more about Pareto's Concept visit our recent post in our blog entitled Listen to the Gemba, "The Pareto Chart." You can also learn more about the Pareto Chart and learn how to build your own in our Lean Six Sigma Yellow Belt Course.
 Click on the photo above to visit Lean Strategies International LLC's Service page. Balance in terms of lean six sigma refers to the even distribution of work elements throughout an organization. A state of balance would be an organization that levels distribution of "hands" performing work and keeps equal or level working times amongst the different types of operations found within the organization.
See also: Heijunka  Click here to purchase this helpful reminder. The seven management and planning tools are often referred to as the seven new tools. This set of tools was developed, tested and used by the Japanese Scientists and Engineers (JUSE). The seven new tools are:
 The longitudinal scope refers to the “length” of a projects process. The most common method of defining the longitudinal scope is from “starting point to ending point.”
 The output is the result of a process being applied to an input. It can be in the form of energy, work, goods, services or activities. The output is the result whether desired or undesired the output is simply the result of a process or function being applied to the input. Y=F(X) + ε, the Y is the output.
Block Scheduling is a scheduling technique where "blocks of time" are set aside to different tasks or projects, such as:
The fishbone diagram is a structured analysis tool used to organize potential causes associated with a specific effect.
Other names:
Related Blogs: Creator:  The ©TREAT 1,2,3 methodology is a problem solving methodology used by Lean Strategies International LLC that when applied to processes (technical, methodological, philosophical) can effectively reveal root causes related to issues / problems or opportunities in a process and guide users towards solutions for a more stable, effective, efficient and value adding process.
RunTime is the time needed or required to process an item. It is part of the actual operations time and usually is defined or specified inside of the routing. The runtime is dependent on the volume or the qty of parts that you are producing.
 Multiple Regression is a form of regression analysis that explains the relationship of "multiple" predictor or independent variables with one dependent variable.
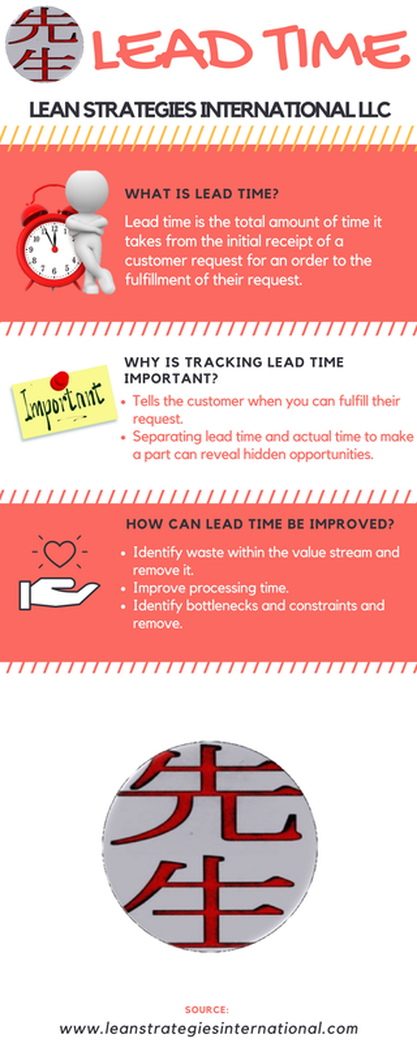 Click on the photo above to download a free infographic on lead time. Lead time is the total amount of time it takes from the initial receipt of a customer request for an order to the fulfillment of their request.
 Setup time is the time required for a specific machine or resource to convert from the production of the last good piece to the next pieces first good part.
|