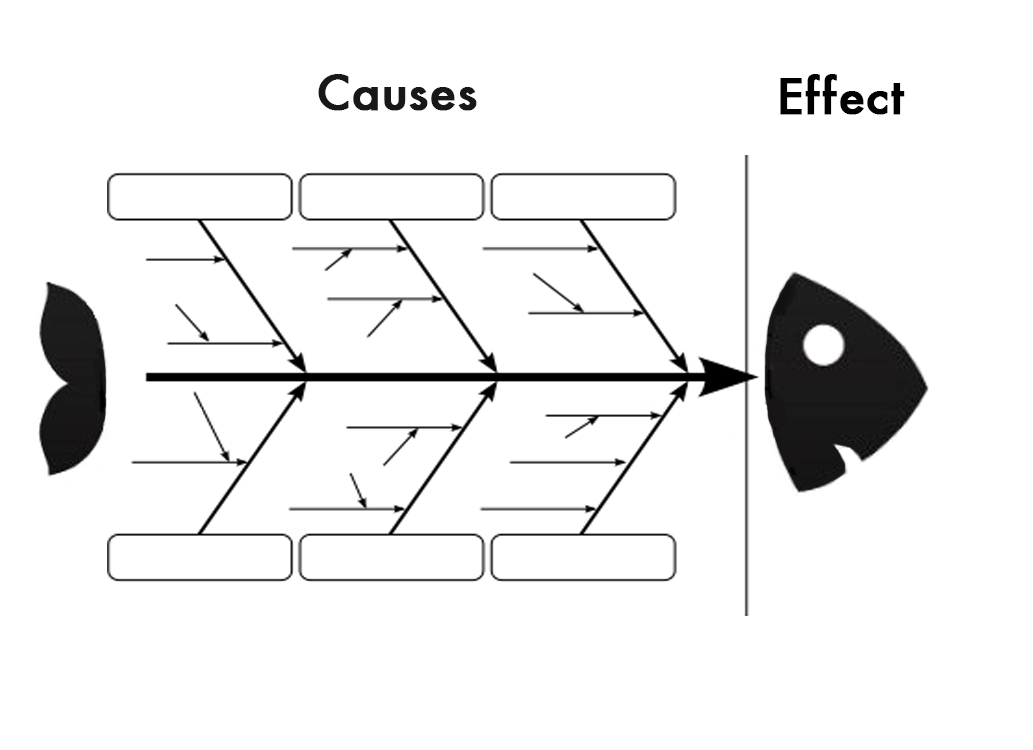
 Click here to enroll in the Fish Methodology. The fishbone diagram, cause and effect, or ishikawa diagram is one of the most common quality tools used today. Best known by its resemblance to a fish's body the fishbone diagram is used to show the many possible causes for an effect. The tool is used to help coordinating brainstorming in an effort to discover root causes. The ishikawa diagram was founded in 1968 by Kaoru Ishikawa. Dr. Ishikawa pioneered a major quality movement while working at Kawasaki. One of the fundamental tools he used on many of his projects was the ishikawa diagram. The tool is still used today by many different industries and has proved its worth on many different levels. One of the most common mistakes made with the Ishikawa diagram is the belief that there are set categories for each of the branches. Although the 6M fishbone and the 8M fishbone are globally recognized as the standard for manufacturing, transactional processes often utilize a 7P fishbone diagram. Ultimately the categories are based on the team's agreement with possible categories that might be related to the problem that is being analyzed. The fishbone diagram is commonly paired with the 5 why analysis in order to drill down to the root cause. Here is a general process that you can follow to conduct a root cause analysis.
There are many different ways of using the fishbone diagram but the 4 steps above should help you get started. Remember, you can enroll in the FISH Methodology course and begin using this powerful tool right away. Challenge:
Have you used the fishbone diagram before? In the comments section below, share your most valuable tip when using the fishbone diagram and receive a coupon for one of Lean Strategies International LLC's courses.
2 Comments
Kus Sularso
12/20/2023 03:40:09 pm
Problem identification is the most critical. 1/5/2024 07:48:31 am
Fantastic! Thank you for sharing your experience with the community Kus Sularso. Here is a coupon for the Fishbone Diagram Course. Enjoy! https://www.udemy.com/course/fishbone-diagrams/?couponCode=966A9D51DF3F7B0423DC Your comment will be posted after it is approved.
Leave a Reply. |
AuthorClick Here to Submit Your Post on Listen to the Gemba. Archives
June 2024
Categories
All
Recommended Readings
Visit our Recommended Reading Page for some great Lean and Six Sigma Books.
|