Lean Strategies International
Menu

Listen to the Gemba

Would you like to submit a post on Listen to the Gemba?  
Click Here to Submit Your Continuous Improvement Post!

Process Mapping - What, Why and How

11/16/2016

0 Comments

 
Picture
  One of the most effective tools any process orientated employee can use is the process map.  The process map has been around since the dawn of time and has evolved into many different iterations in order to meet users needs.  Along with the flexibility of a process map it's quite effective at showing a user where pain points in a process might be.

What is a process map?

  Process mapping refers to a tool used to make business processes visual.  The process map documents an entire process step by step which allows us to see relationships between inputs and outputs of a process along with clear identification of decision points and many other steps in the process series.  The process map is generally used towards the beginning of initiatives in order to understand the flow of a process but it can also be used in support of almost every phase of improvement projects. ​

Different Types of process maps:

  Traditionally there are many different types of process maps that have been developed and used.  For example a SIPOC and a value stream map are forms of process maps but generally provide a much deeper level of understanding as they identify information flows too.  In general there are three different categories of process maps:
  1. Systematic maps - Show us the entire system at a very high level.  Systematic maps often extend beyond an organization's boundaries. 
  2. Cross functional maps - Cross functional maps will show us a process from one end of the organization to the other.  They allow us to cross department functions and see clearly where ownership of each process step is held at.  The use of swimlanes is one example of a cross functional map.
  3. Process level maps - Process level maps give us a detailed view of a process.  These types of maps are very useful for cells and production lines contained in one department.

Why do we process map?

  In general process maps provide us with a visual display of the sequence of steps within a process.  They can also be used as a method of communication.  We have all been a part of a project that goes around and around in circles trying to remember and figure out what actually happens in a process.  When we make those steps visible the process is communicated to everyone in a more understandable language.  There may be times where you need to add in steps here and there but with the map visual and near the area where the process actually occurs, the communication of the process is much more accurately defined.  Another very common reason for process mapping is that a visual map can aid us in the analysis of a business process.  Some of the ways we can use process maps to analyze are:
  • Identify parts of a process where errors occur such as re-work flows.
  • Establish measurements/data at various points of the process.
  • Show boundaries.
  • Show stakeholders.
  One of the drawbacks often associated with process mapping is that it tends not to capture elements such as information flow, where a value stream map gathers both information and material flow.  

How do we build a process map?

  Process mapping is a fairly simple process to learn.  But there are a few general rules to follow when you build a process map.  
  • The first thing to keep in mind when you are building a process map is to start from the gemba, go and walk the process from start to finish.  Take notes if you can, but really understand how things are actually happening where the process takes place.
  •  If at all possible try to establish and area where you will be building your process map close to the gemba or where the work is done.  
  • Another key element to remember is to include the people from the gemba in the mapping process.  They are the experts who work on the process everyday and can identify what is actually going on.
  • Next, start your map from a high level.  Be sure that everyone has a good level of understanding of the process before you begin digging in.  Remember problem solving will come later so keep a parking lot handy where you can place possible solutions but don't address them until the appropriate time.  
  • Make the map as simple as possible.  There are lot's of symbols but try to stick to the basics.
  •  Last but not least be sure to validate your map with stakeholders.

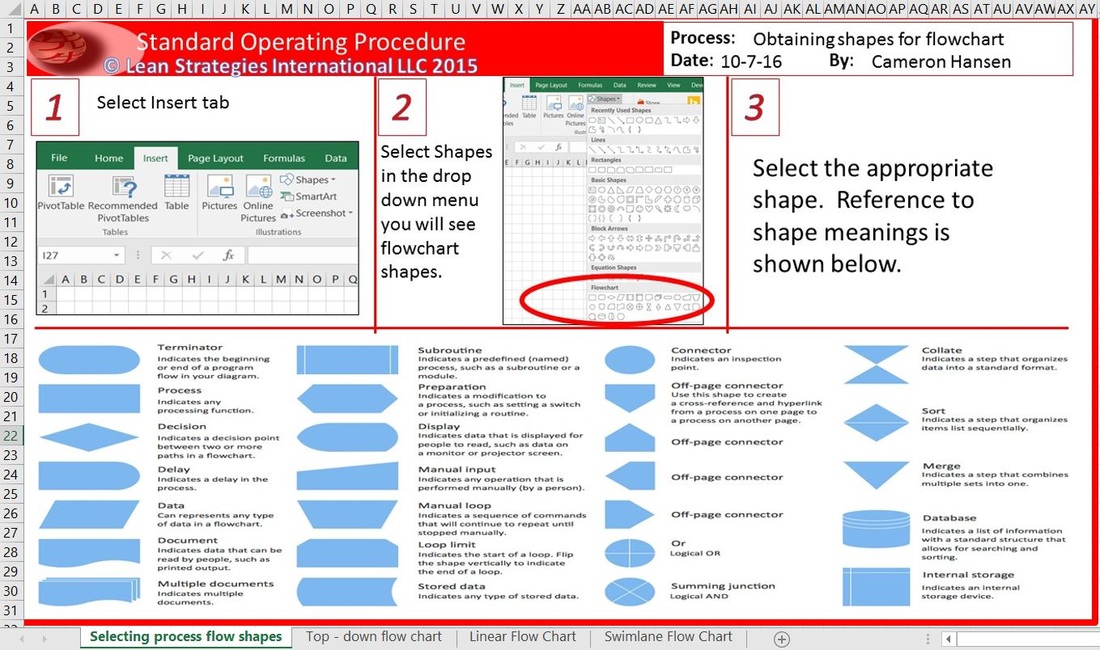
​Different Tools for Building your Map:

  Process maps can be built with stickie notes and butcher paper, excel, powerpoint, word or in vizio.  Over the years I have grown to love stickies and butcher paper because it is much less restrictive and can be built anywhere. For our purposes today though we will use excel to build our process map. Today we will cover three types of process maps:  The top down flow chart, the linear flow chart and the swimlane or cross functional flow chart.  If you haven't downloaded a template yet, you can do so by clicking here.

  The first thing you will want to look over is the first tab of the template.  Excel makes it very simple to choose your symbols by simply clicking on the insert tab and selecting shapes.  At the bottom of the shapes you will notice symbols for building a flowchart.  You can try to memorize them right away but there is also a reminder of the symbols meaning in the first tab.
Top Down Flow Chart:

  This type of chart is great for mapping at a high level and drilling into deeper levels.

1.  First list your process at a very high level.  let's say we are baking a cake.
  • First we get out ingredients.
  • Then we mix.
  • Next we bake ingredients.
Picture
Symbols shown in first tab of template.
  • Serve Cake
  • Eat
​  So we input those high level steps into the template just as it's shown below.
Picture
  The great thing about a top down chart is that we can still drill into each of the process steps below it.  2. We then can ask the subject matter expert,  "what do you have to do to get the ingredients out?"  The person baking the cake might say:
  • I need to get out eggs.
  • I need to get out flour.
  • I need to get out sugar etc.
  We then list those process steps below the high level steps in order to understand the details of each high level process step.  You then would complete the process for each of the high level steps in your top down process map.  This type of process map is actually very useful when you are starting off a mapping project.  
Picture
Linear Flowchart:

  The next type of map you will find in your template is known as a linear flowchart.  The linear flowchart is a diagram that displays the sequence of work steps that make up a process.  It will show decision points, rework loops and a few other elements.  Let's make a linear flow chart for our cake.  
  1. Insert terminator symbol for our starting point.
  2. Insert a rectangle or a process function for get out ingredients.
  3. Next let's say we need to check to see if we have all the ingredients.  This is a decision point so we will enter our diamond.  One path will be yes and one path will be no, just as shown below.
Picture
4.  We then continue each process path until the end goal is achieved as shown to the right.

  You may have noticed already but the linear flowchart is a fantastic tool to use for identifying improvement opportunities.  We can see that there are  two very obvious re-work loops.
Picture
Swimlane Flowchart:

  The final flow chart we will look at is the swimlane flowchart.  These types of flowcharts are often referred to as deployment flowcharts too.  The swimlane flowchart is used to distinguish what  job function of the organization is performing what steps.  They can be used to show back and forth activities between steps and unlevel workflows.  
  1. Start off by identifying the departments/job functions within the process you will be mapping.   In our case we will map a grocery check process.  Our departments or process owners are: customer, cashier and manager and bagger.
  2. Now we will map the process flow the same way we did with our linear flow but we will keep activities in the swimlane of the owner just as shown below.
Picture
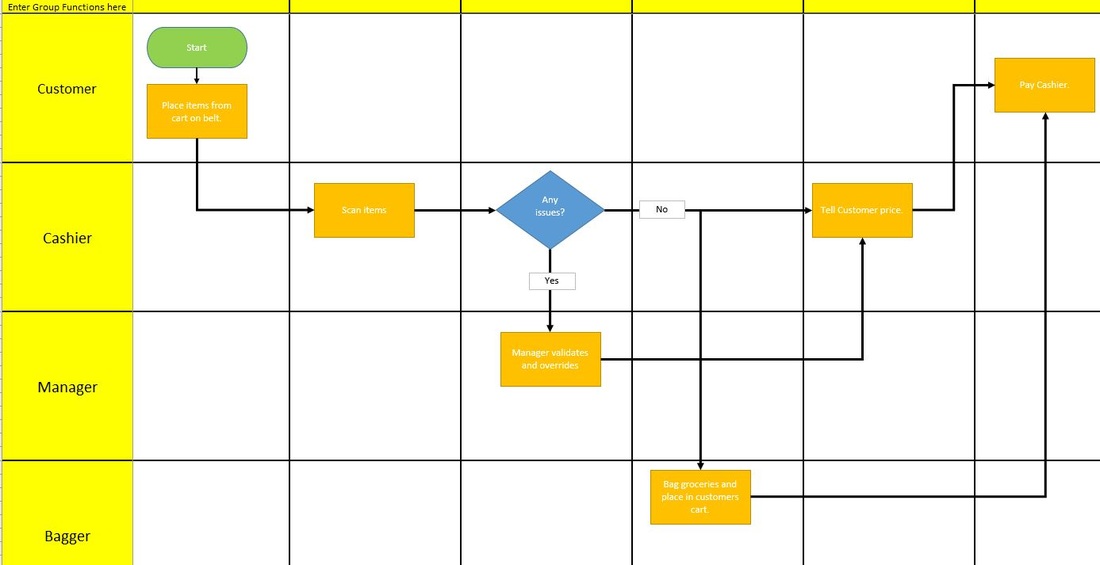
  As you can tell in the swimlane diagram above we can see very clearly who is responsible for what process step.  If there were overlapping steps we would see those stacked which may be a trigger that there is an opportunity for improvement.   

What should process maps have?

  Like any other map a process map has a few unspoken rules we should do our best to adhere to.  First and foremost be sure to label the process name and the team somewhere on the map just in case there are any questions.  You may also want to place a date on the map of when it was created.  Next the process map should be very simple to read, it needs to go in one direction not up and down and side to side.  Try to keep a flow that is either left to right or top to bottom.  You will also need to identify start points and end point and keep all of your loops closed.  Did I include all these unspoken rules?

Helpful things to look for in a map.

  We mentioned a few items to look for in our process maps but let's summarize them here now that you are an expert.
  • Keep your eyes peeled for redundant steps.
  • Be on the lookout for back and forth activities.
  • Delays.
  • Rework loops.
  • Inventory.
  Process mapping can be a very powerful tool to use in improvement projects and can help others see opportunities to improve too.  You never know, if you do enough of them you might start thinking in a process orientated manner.
0 Comments

Your comment will be posted after it is approved.


Leave a Reply.

    Author

    Click Here to Submit Your Post on Listen to the Gemba.

    Archives

    February 2023
    January 2023
    December 2022
    November 2022
    September 2022
    August 2022
    June 2022
    April 2022
    October 2021
    August 2021
    July 2021
    June 2021
    May 2021
    April 2021
    February 2021
    November 2020
    August 2020
    June 2020
    March 2019
    January 2019
    March 2018
    February 2018
    January 2018
    December 2017
    September 2017
    August 2017
    July 2017
    April 2017
    March 2017
    February 2017
    January 2017
    December 2016
    November 2016
    October 2016
    September 2016
    August 2016
    July 2016
    May 2016
    April 2016
    March 2016
    February 2016
    January 2016
    December 2015
    November 2015

    Categories

    All
    7 Management/Planning Tools
    Cause Effect
    Continuous Improvement
    Just In Time
    Lean-and-quality
    Lean-and-quality
    Lean-assessment
    Lean Basics
    Lean Courses
    Lean Holidays
    Lean Leadership
    Lean Metrics
    Lean Sales And Marketing
    Lean Six Sigma Basics
    Lean Strategy
    Lean Tools
    MRP/ERP
    Q&A
    REDUCE/SMED
    Six Sigma Tools
    Standardization
    Submit A Blog Post
    Top 20 Lean Tips
    Updates
    Waste

    Recommended Readings

    Lean and Six Sigma Recommended Readings
    Visit our Recommended Reading Page for some great Lean and Six Sigma Books.
Lean Strategies International LLC.
Follow Us on YouTube or Our Other Channels Below.
             ©2015-2021 Lean Strategies International LLC.  
  • Home Page
  • Services
    • Training >
      • Waste Training
      • Introduction to Lean
      • Lean Champions >
        • Lean Six Sigma White Belt
        • Lean Six Sigma Yellow Belt
      • Lean Tools You Can Use Series! >
        • The 5S System
        • The ©Gemba Methodology
        • The FISH Methodology
        • The CURE Methodology
        • Quick Changeover with REDUCE
        • Mistake Proofing and the Poka Yoke System
        • The Just in Time System
  • Lean Resources
    • Listen to The Gemba
    • Glossary
    • Lean and Six Sigma Quotes
    • Recommended Reading
    • Events
    • Masters of Lean and Six Sigma
    • Career /Jobs
  • Store
    • Workspace